What Can Field of Dreams Teach Us About Corn And Trading Macro? 29 Sep 2019 6:21 AM (5 years ago)

Last night I wasted Field of Dreams with the kids. Plenty of complaints before the start. One wanted to watch Avengers, another didn’t want to watch a sports movie. The other one was opposed to the entire endeavor.
They came around pretty quick. But here was my big takeaway: I’m on the verge of becoming a naturalized citizen in the commodity world--I couldn’t stop thinking about how all the farmers were appalled and outraged when Kevin Costner dug up his corn to build the baseball field. And then there was the clearly disastrous financial implications, where this decision put his farm on the verge of bankruptcy.
I had questions. 1) how much corn did he dig up? 2) how much revenue did he forego, in absolute terms and relative to the size of the farm? 3) Given a few assumptions, was this really a farm-wrecking decision, or was this Hollywood stuff?
In 1987 many farms in Iowa were between 250-500 acres, and this same data shows a husband/wife team could have eked out a living managing such farm. Let's assume this was a 250 acre farm.
The average value per acre in Iowa was $875 in 1987, around the depth of the US farm crisis. A 250-acre farm could have been had for around $220,000. Lets call it $280k with a modest farm house on the property. Putting say, $60k down on such a property was certainly within reach for a college educated, dual income couple in their mid-30s that has been working and saving for 10-15 years.
The average farm price for corn in 1987 was $1.89/bushel. And one might expect an acre of corn to yield around 120 bushels of corn.
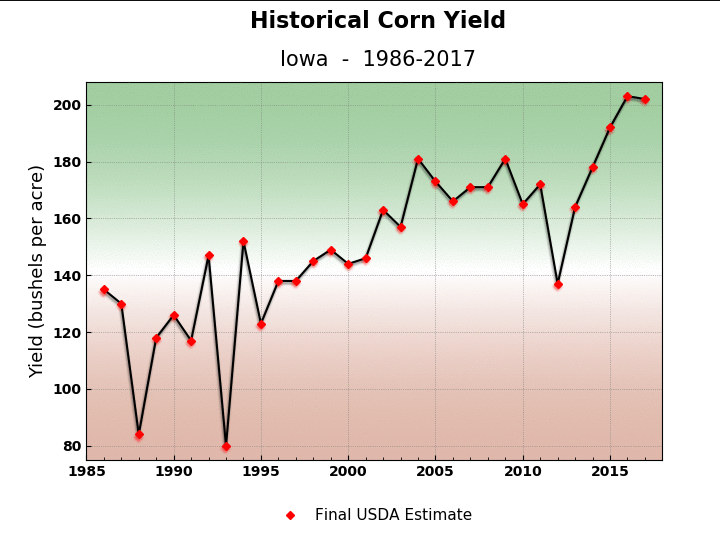
So 250 acres of corn, yielding 120 bushels nets you 30,000 bushels of corn. Lets say Kevin Costner is a particularly crafty basis trader and he gets $2/bushel for his corn. He grosses $60,000. The 1987 census report above suggests such a farm might generate $20-$30k in net income--enough to live on if you’re into the lifestyle--but there were many farms during that time that were losing money. Bankruptcy was certainly on the mind of every US farmer in the mid-late 80s.
But with foul territory and some residual space for bleachers, you’re probably looking at another acre. But no more than 4.5 acres total, even if you add in a few parking spaces.
Let's say Kevin Costner dug up four acres of corn. That’s less than $1000 in foregone revenue in the year he dug it up (it probably had some residual silage value!) and in the new crop year when Shoeless Joe finally showed up.
So our hero gave up $1000 out of $60,000 in revenue, and maybe $30,000 in net income. Let’s add on another $1000 for the infield dirt, the grass he planted, and the backstop fence. Despite the gossiping and murmuring of the other farmers and their wives, he certainly could have billed it as a community service--and heck, even written it off on his taxes--since presumably he didn’t just let the field sit there..he let the local farm-kid teams play on it while he was waiting for whatever was supposed to happen.
An aggressive financial decision, but one easily justified by hearing a voice say, “If you build it, he will come.”
Kevin Costner made one crazy, totally unjustifiable decision: he lit the field!!

This, is what would have bankrupted his farm. This is the decision that would have had his smarmy brother-in-law questioning his sanity. Lighting the field today would easily get you into six digits, and would certainly have been out of reach for a financially strapped family farmer in the midst of an agricultural crisis.
Sure, it made for the coolest scene in the movie.

But completely implausible.
Here’s a few light-hearted takeaways for market analysis:
Question assumptions. We all have a cognitive bias to buy into what we’re being told. It’s called “Truth Default Theory”. It’s what makes movies work….but it often turns into a trap in markets.
Sometimes the trade is not where you think. Everyone jumped on Kevin Costner for digging up his corn--but it was the lights that were financially reckless.
Everyone loves a story. Many trades are long on “story” because stories sell. You’re not going to get your boss to buy into upsizing your trade because of your spreadsheet. You need a story.
But….every story needs data. Stories without data are just that, Hollywood stories. A good story combined with solid data can go a long way.
But most important:
Be open to changing your mind. I didn’t mention this above, but the key point of the movie is when the fussy pants brother-in-law has his epiphany. This was a man that was deep into his own trade to buy Kevin’s farm. But he changed his mind. That this was done only with divine intervention is irrelevant! Too often we get wedded to ideas and refuse to accept the metal cost of accepting that we were wrong and changing course.
Love your ideas, but don’t be afraid to set them free.


Curve Flattening and Monetary Policy Effectiveness: Is It Different This Time? 2 Sep 2019 8:18 PM (5 years ago)

No doubt you’ve read something about the flattening of the yield curve. You may have even heard it inverted. I can always tell when an arcane financial concepts hit the mainstream by when my relatives ask me about it. I’ve gotten that one a few times lately.
But let's take that question at face value. Let’s put aside curve inversion for a moment. What does a *flattening* yield curve mean for monetary policy and the economy?
Mohamed got me thinking about that question this afternoon:
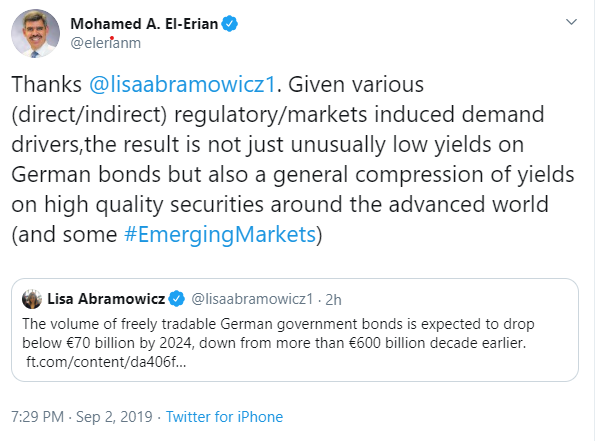
The biggest story in financial markets over the past year is not the inversion of the US yield curve, but the bull flattening of the bund curve: here is a chart of Germany 5y/30y slope vs. assets on the ECB balance sheet:

The end of the ECB’s asset purchase program coincided quite closely with a slowdown in global growth that resulted in the bull flattening of the 5y/30y bund curve. What does that mean? Slowing growth--but also little optimism for a pickup in growth or inflation in the future. Combine that with the factors Mohamed mentioned and you have the recipe for a very big bull flattening.
Fast forward to the next ECB meeting. How should monetary policy react? Traditionally, as growth slows monetary policy eases, either through rate cuts, or more recently, asset purchases. You can see that clearly in the chart above in 2015 and heck, right through to 2017.
The flattening in 2014 and again in 2016 both reversed out quite nicely--the first time the result of increased QE from the ECB, and the second time after global growth recovered from the nadir of China growth fears and low oil prices in early 2016.
Where does that leave the ECB today? In a heap of trouble. They need to steepen the curve.
Among the myriad problems in Europe are their banks. The flat curves, low growth, and regulatory constraints have strangled big European banks. Look at this chart of return on equity in European banks vs. US banks:

Sources: Bloomberg, Federal Reserve Bank of St. Louis (FRED)
A flat curve means that banks can’t borrow low (from depositors) and lend high (to borrowers). They have to rely on credit spreads or simply do nothing at all and make money off fees. When banks can’t make money on lending, credit growth suffers. A similar chart of US vs. European credit growth would show a similar dissonance between the US and Europe.
The ECB must find a way to steepen yield curves. How can they do it? Easing monetary policy *must* be a signal for higher growth and inflation, otherwise it is ineffective and most likely counterproductive. If the ECB believes further easing won’t steepen yield curves, they should say so explicitly and tell the government this is their problem now.
That would lead to an easing of fiscal policy--via issuing more long end bonds. That would give Mohamed the supply he so desperately wants for his friends at Allianz.
Now, let's contrast the situation in Europe with what we see in the US:
By way of example, look what happened back in 2007: when the Fed started cutting rates, the 5/30y UST spread started to steepen--as one would expect if monetary stimulus coinciding with the end of the business cycle leads to higher growth in the future (the vertical line coincides with the first cut from the Fed).
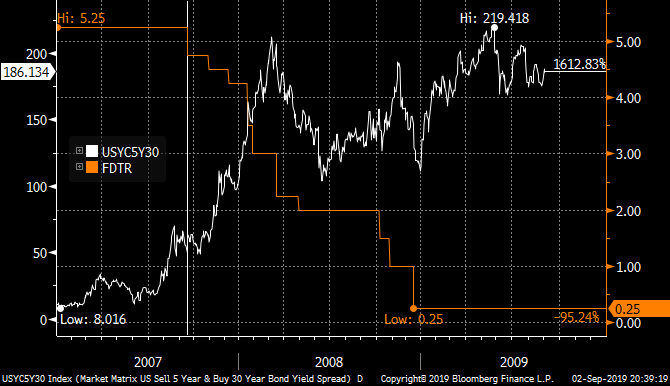
Throughout 2008, the curve stayed steep...going over 200bps in mid 2009. The first round of QE
Steepened the curve even more: 5y/30y spread topped out at over 250bps in 2010.
That was very supportive for credit growth--which is one of monetary policy’s core transmission mechanisms.
Now, looking at the situation today: here is the same chart, 5y/30y ust spread and the fed funds rate.
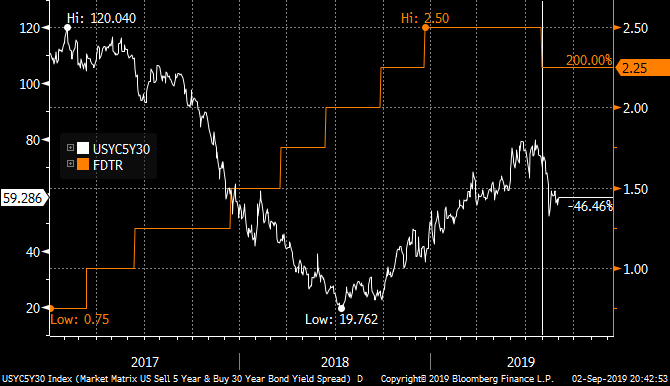
This time, the curve FLATTENED when the Fed started cutting rates.
The market is telling the fed and the ECB that they don’t believe the traditional monetary policy transmission mechanisms work anymore.
Do you believe the market has that right? The market opportunity is clear---bet on further flattening and stagnation if monetary policy is broken--bet on steepening if you think a combination of normal business cycle re-ignition and Fed and ECB easing can sort this out and return growth to trend.
My take: I think the market has gotten way out ahead of itself and is trading on 1) fear and 2) momentum. Real money guys benchmarked to indexes--who happen to be getting eaten alive by passive indexation--caught on to the rally in the front end, but have reacted by buying long end duration and convexity. They are going to stay long until proven otherwise. Nobody wants to be left behind in the great bond rally of 2019.
Now, put on your behavioral finance hat. If you have skin in the game, ask yourself or your colleagues these types of questions:
- What is the probability the US and/or European governments pass fiscal stimulus packages of at least 2%/GDP per annum?
- What is the probability that US and European monetary policy will prove ineffective over the next year--as demonstrated by a 5/30y curves in US and Germany flatter 1 year from now vs. where they are today?
- How much of this is Soros-esque reflexivity, reflecting the “fear of fear itself” and a self-fulfilling prophecy of lower long-term interest rates? If you buy into that--what evidence can you bring to the table?
- Curves have re-steepened in the past--prove to me why this time is different.
These are the type of questions that can get us past rank speculation and productive discussions about what is baked into the markets and how we can exploit that to generate alpha.
skewrisk@gmail.com
@EMinflationista
skewrisk@gmail.com
@EMinflationista
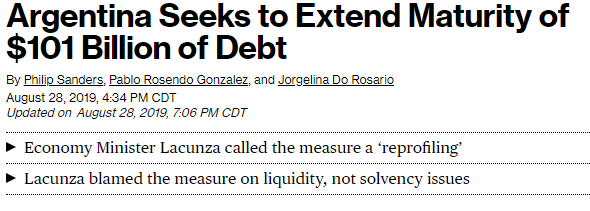
The Argentina Siren Song And Where Else It Is Sung 28 Aug 2019 8:07 PM (5 years ago)


I’m back! After an extended leave of absence I’ve decided to start writing again.
Let’s start with a story familiar to those that read MM in my first term: Argentina.
That cute little fella at the top of the page is already back, only a few short years after Macri’s victory put an end to the sordid story of Argentina’s last debt default in 2001.
I’m not going to get into the economics or the various mistakes made by the current government and the IMF.
Take a step back and think about how we got here, and the investor psychology required to move headlong back into Argentine debt:
- October 2015: Mauricio Macri defeats the ruling party-backed Daniel Scioli, putting a non-Peronist government back in power for the first time in a really long time.
- Macri appoints one of the most technocratic governments in the history of emerging markets. Argentine economists up and down the tri-state area that had sought refuge on Wall Street over the past 15 years came home to work for and support the new government.
- This new economic team quickly implements a series of orthodox policies and pitches a market friendly reform agenda with the goal of kick starting investment and growth.
- Macri quickly negotiates an agreement with holdouts from the previous debt default, and issues a ton of bonds to pay them off and fund massive twin deficits
- Investors rejoice and welcome Argentina back into the loving embrace of EM
None of these really look like mistakes, do they?
It started off well. The new bonds did well enough that the government was able to issue the famous Argentina century bond in June 2017. Later that year the government won important midterm elections that were seen as an important barometer for Macri’s success, political capital and chances of winning re-election.
Less than two years later, this is the chart on the Argentina 2021 bond...which traded at 110 in Q3-17:
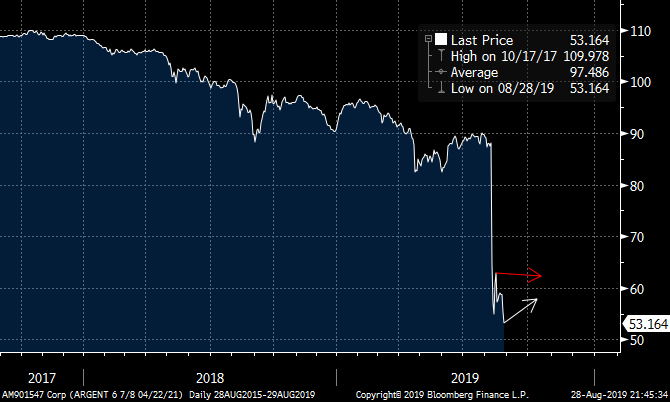
Those arrows are supposed to end in a skull and crossbones.

There, you get the idea. That’s what they call a “sudden stop” in emerging markets. That influx of foreign capital has gone to money heaven. It doesn’t come back...the next one to bring capital to Argentina is that bird--which is why we’re already at this stage:
You can cite a few reasons for the descent from ten points over par to recovery value in less than 24 months. The government failed to deliver on growth, didn’t get pension reform done, there was a drought, low soybean prices, crappy growth in Brazil, USD strength, global manufacturing slowdown, you name it. Sure, maybe a confluence of all those things.
But let's look back at the initial bullet points. Where did Macri go wrong?
I’d argue it was in the hiring of a ton of technocrats to run the economic program.
One can imagine how the conversations went. We’ll pay off Elliott. We’ll float the peso. We’ll institute inflation targeting at the central bank. Investors will love it. They’ll come to us in droves.
Yep, that’s how it went down. These guys played a siren song for EM investors, and they ate it up. They played every tune that is music to their ears….abolish capital controls, reform, inflation targeting, de-regulation, tax cuts...liquidity….oh yeah baby…
Before you know it, by mid-2018 there is $100bn in debt on the books and the fundamentals are deteriorating. Suddenly the IMF is back in town, an organization that has a favorability rating in Argentina on par with Trump on your average university campus.
By 2019 the IMF has stabilized the situation well enough to buy Macri some time ahead of the October election. The economy wheezes along. Do investors take advantage of the opportunity to scale out of Argentine debt, given the poisonous political nature of the government’s economic record--and one that got into bed with the IMF?
No, instead foreign investors ate it up! This is a list of the top ten holders of the Argentina 2021:

Same chart for the argentina 2028 (the only one that is reducing is blackrock, and only because they updated their data already):
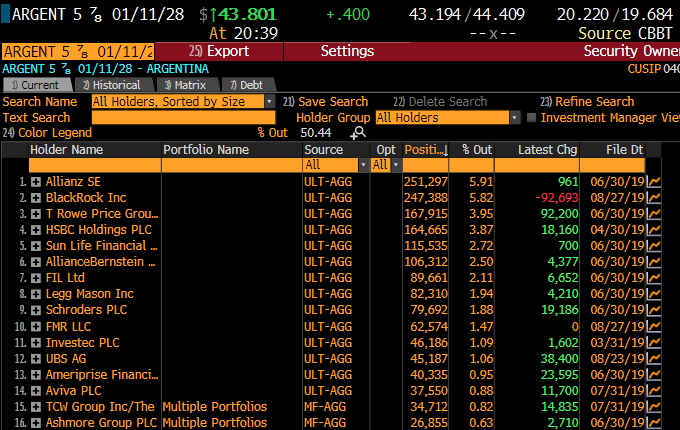
Real money was not only holding these bonds, they were buying more. They were convinced Macri was going to win and make them a fortune. Take a look at the country weights of some of these mutual funds: you’ll find one after another is, or was anyway...overweight Argentina.
They bought into the swan song that the government told them. They succumbed to one of the classic behavioral biases: affinity bias. “These guys are just like us! They say they’ll win the election. We can trust them.”
There is also some confirmation bias there--where investors believed the orthodox path the government had taken was going to work. Why? Because that’s what they taught us in school! And the election?? Well, those Argentines….they know better than to bring the Kirchners back in, right?
And there is the last big mistake. Can you name one technocratic, dare I say, elitist, candidate that has won an election lately? One might say Macron...but look how that’s turned out. Sank without a trace.
Yet despite a terrible economic record, a leg shackled to a hated foreign organization and a global trend against orthodox, technocratic politics, foreign investors convinced themselves that Macri was going to win.
Right until he lost big.
And that brings us back to what Argentina can teach us about the rest of the world. Where else are investors buying into the swan song?
- Brazil: sing it to me Captain...pension reform….deregulation….but growth still sucks and the government is still drowning in debt and red tape
- Italy: wait, it is POSITIVE the most popular politician in the country just got heaved out of the government? That is going to make him LESS popular?
- UK: Maybe Boris can pull it off. Or maybe people still believe he can.
- United States: I can think of one good scenario going into the 2020 election, but it involves Joe Biden. With the S&P 4% off the highs, investors believe the most beautiful song is still sung by US multinationals.
This was a big land mine for foreign investors. They stepped on it--not just because they got the story wrong--which happens to everyone. But because they had a few behavioral blind spots that we can all learn from.
@EMInflationista
@EMInflationista
Play nicely, please. 8 May 2019 6:14 AM (5 years ago)
I've not been following the comment section in recent months, but it seems as if trollery has returned in force. Please use this post for fresh discussion, and if you're a troll please move along. (Let me know if commenting privileges are being abused, please.)
Special Guest Post: PG&E's Risk Management Fail 15 Jan 2019 3:56 PM (6 years ago)

There’s a saying that goes
“mistakes are the tuition of learning”. The PG&E case in California is rife
with risk management lessons where we can learn from the mistakes of others
while they pick up the tab.
A big story in the financial news lately is the significant
liabilities incurred by Pacific Gas and Electric or PG&E, the biggest
electric company in California. The company’s core business is to generate and
distribute electricity, and as a part of that business, they maintain the power
lines that connect the power grid.
Government authorities have concluded that many of the fires
that ravaged California over the past two years have been the result of power
lines falling into trees, and California law finds PG&E liable for any
costs related to fires where power lines were at fault. Matt Levine, a man so cynical and sarcastic he makes me look downright kind and forgiving, crushes the capital structure story. Levine brilliantly points out that there weren't any secrets here....only a massive unfunded liability that had PG&E whistling past the graveyard for years...and certainly throughout 2018.
PG&E is, for all intents and purposes, bankrupt. How did a regulated utility get to that point so quickly? What were the warning flags? Was there a trade here?
Let’s take a look at how a macro trader might have thought
about the risk in PG&E stock.
Here is the stock chart back to 2004. In early 2017, you
were probably feeling pretty good. Nice run higher. No big surprises. The
dividend has been increased consistently over the past two years and credit
ratings has been raised.
PG&E Stock Price, 2004-2018

Source: Bloomberg
Then in early 2017 a fire in northern California burned
36,000 acres and destroyed 5600 structures, including 2800 homes and killed 22
people. The stock fell precipitously. The 1 week fall in the stock price
was somewhat similar to what happened in the financial crisis.
As a macro trader, how did you price fire risk before
and after the 2017 fires?
Did you have this quote in your back pocket as the risk
manager? ““California law
makes utilities responsible for any fire started by their equipment, even if
they weren’t negligent.” If you did, you might have forecasted a big loss, bigger than any
drawdown in recent history--and certainly bigger than the PG&E liquid balance sheet-- based on the damage estimates of fires in recent
history.
But as Donald Rumsfeld taught us, there are "known knowns" and unknown knowns, In 2017 the game changed….PG&E fire risk was a "known known". Ben Hunt at Epsilon Theory might say fire risk at PG&E in 2018 was public knowledge, but not *common knowledge*. The balance sheet tightened and politicians started to circle the company. While there was an effort to protect the company from further extreme liabilities by allowing them to pass costs from these liabilities onto ratepayers, the latest round of fires in 2018 that were even more severe in terms of acreage, homes and lives lost, put the company in even greater peril. Now bankruptcy is on the table.
When the November 2018 Camp Fire destroyed about 10,000 structures, about 100 people and wiped an entire town of 20,000 people off the map, PG&E was finished. But even then, it took a while before common knowledge caught up.
Yet those looking for how this risk was priced could have also used
credit markets to illustrate this increasing risk…below I have a chart of
PG&E’s credit risk in 5 year credit default swaps (CDS). Note how
throughout 2018 credit risk was increasing (a higher or wider CDS spread
reflects an increasing risk of default), even before the Camp Fire Bottom line, bond
markets sniffed this out while equity markets pushed the stock 9% higher in
2018 before the fire on November 8.
PG&E 5y CDS

Source: Bloomberg
Do you think it was a coincidence that PG&E management did little to recapitalize the balance sheet for fire liabilities or commit to an extreme and fast maintenance fix when they couldn't pass the costs on to tax payers? Which means....it would have been at the cost of the stock price, their bonuses, stock options and probably jobs?
PG&E management and stockholders clearly dramatically underestimated
the costs and liabilities attached to fire risk. Some was willful, some was stupidly optimistic, and some was no doubt simply a combination of unlucky and ignorant. The fires had incredible
human costs. It will also go down as a case study in capital structure, management incentives, and the value of macro analysis that identifies incentives and opportunities across asset classes.
P/E's are re-rating 18 Oct 2018 7:43 AM (6 years ago)

Its been a long time, we shouldn't of left you
While its been a while since I posted here, not much has really changed in financial markets this year. People still worried about China, US FAANG stocks still going up, Europe is always a mess.
While there have been moves in sectors and markets this year for sure (EM and Frontier managers have been busy) the real big change in markets, which perhaps still needs many more months of digestion is the rise in US Long rates (ie 10 and 30 years). Since breaking the psychological levels Gundlach and others have mentioned as 'lines in the sand' price action has been pretty boring. But I do tend to agree with them that rates have entered into a new regime.
Of course the first asset class to react to higher rates was the Dollar and EM. They seem to have quite a bit priced in already and add in a pinch of China slowdown concerns its easy to see why they have under performed. I dont have much to add. Perhaps they are oversold. You can add in US homebuilders and Capital Goods to that list as well.
The next to go IMO has been parts of the duration trade. Muni's, preferreds. They have moved a little but they can still move a lot more if rates go much higher.
The last to go, and we all knew it was going to take more time than markets, was the US stock market. Its been the best place to be for the past several years and its more of a growth vs value play which means rates matter even less.
If you only follow the price chart, you could be forgiven for assuming the current bull is intact. I'd have to agree as there has yet to be a flashing 'dow sell signal' yet. Though I could easily see a topping pattern set up from here.
But lets turn to a few charts of the market P/E and EPS, which combined give you the price.

You can see that for most of 2017, 17.5x PE was a nice level the market was supporting. Then in January, when analyst estimates really got revised higher for the tax reductions we dropped down to 16x. Its been hanging around 16-17 for most of the year and on the recent dip, dropped below 16. Some, like Morgan's equity strategist now see 16 as the ceiling for the market, not the floor. His reasoning is that higher interest rates impact investors risk premium. Something to think about. Russell seems to have go the message loud and clear

While companies in the US may still be beating earning and buying back shares, its possible that investors re-rate regardless.

Now what happens is EPS estimates start to turn down, like they are in Europe. Well then that would be cause for real concern. But we're not there yet.
%20the%20real%20big%20change%20in%20markets,%20which%20perhaps%20still%20needs%20many%20more%20months%20of%20digestion%20is%20the%20rise%20in%20US%20Long%20rates%20(ie%2010%20and%2030%20years).%20Since%20breaking%20the%20psychological%20levels%20Gundlach%20and%20others%20have%20mentioned%20as%20'lines%20in%20the%20sand'%20price%20action%20has%20been%20pretty%20boring.%20But%20I%20do%20tend%20to%20agree%20with%20them%20that%20rates%20have%20entered%20into%20a%20new%20regime.%3Cbr%20/%3E%0A%3Cbr%20/%3E%0AOf%20course%20the%20first%20asset%20class%20to%20react%20to%20higher%20rates%20was%20the%20Dollar%20and%20EM.%20They%20seem%20to%20have%20quite%20a%20bit%20priced%20in%20already%20and%20add%20in%20a%20pinch%20of%20China%20slowdown%20concerns%20its%20easy%20to%20see%20why%20they%20have%20under%20performed.%20I%20dont%20have%20much%20to%20add.%20Perhaps%20they%20are%20oversold.%20You%20can%20add%20in%20US%20homebuilders%20and%20Capital%20Goods%20to%20that%20list%20as%20well.%3Cbr%20/%3E%0A%3Cbr%20/%3E%0AThe%20next%20to%20go%20IMO%20has%20been%20parts%20of%20the%20duration%20trade.%20Muni's,%20preferreds.%20They%20have%20moved%20a%20little%20but%20they%20can%20still%20move%20a%20lot%20more%20if%20rates%20go%20much%20higher.%3Cbr%20/%3E%0A%3Cbr%20/%3E%0AThe%20last%20to%20go,%20and%20we%20all%20knew%20it%20was%20going%20to%20take%20more%20time%20than%20markets,%20was%20the%20US%20stock%20market.%20Its%20been%20the%20best%20place%20to%20be%20for%20the%20past%20several%20years%20and%20its%20more%20of%20a%20growth%20vs%20value%20play%20which%20means%20rates%20matter%20even%20less.%3Cbr%20/%3E%0A%3Cbr%20/%3E%0AIf%20you%20only%20follow%20the%20price%20chart,%20you%20could%20be%20forgiven%20for%20assuming%20the%20current%20bull%20is%20intact.%20I'd%20have%20to%20agree%20as%20there%20has%20yet%20to%20be%20a%20flashing%20'dow%20sell%20signal'%20yet.%20Though%20I%20could%20easily%20see%20a%20topping%20pattern%20set%20up%20from%20here.%3Cbr%20/%3E%0A%3Cbr%20/%3E%0ABut%20lets%20turn%20to%20a%20few%20charts%20of%20the%20market%20P/E%20and%20EPS,%20which%20combined%20give%20you%20the%20price.%3Cbr%20/%3E%0A%3Cbr%20/%3E%0A%3Cdiv%3E%0A%3Ca%20href%3D%22https://blogger.googleusercontent.com/img/b/R29vZ2xl/AVvXsEh71DLXlscyQpcddhNmSmxJTkA09SsJGHpbohSEZse7NMhzDaB8qTXHPQmcIw2zIoim4rCc1fScBimqmcIWmMlz6L-w_3PJDsFGjJxo7fWttbMXvoEaeaXxSCtHWWtue0gXa-dIEQ/s1600/spxpe.png%22%20imageanchor%3D%221%22%3E%3Cimg%20border%3D%220%22%20data-original-height%3D%22491%22%20data-original-width%3D%22869%22%20height%3D%22360%22%20src%3D%22https://blogger.googleusercontent.com/img/b/R29vZ2xl/AVvXsEh71DLXlscyQpcddhNmSmxJTkA09SsJGHpbohSEZse7NMhzDaB8qTXHPQmcIw2zIoim4rCc1fScBimqmcIWmMlz6L-w_3PJDsFGjJxo7fWttbMXvoEaeaXxSCtHWWtue0gXa-dIEQ/s640/spxpe.png%22%20width%3D%22640%22%20/%3E%3C/a%3E%3C/div%3E%0A%3Cdiv%3E%0A%3Cbr%20/%3E%3C/div%3E%0A%3Cdiv%3E%0A%3Cbr%20/%3E%3C/div%3E%0A%3Cdiv%3E%0AYou%20can%20see%20that%20for%20most%20of%202017,%2017.5x%20PE%20was%20a%20nice%20level%20the%20market%20was%20supporting.%20Then%20in%20January,%20when%20analyst%20estimates%20really%20got%20revised%20higher%20for%20the%20tax%20reductions%20we%20dropped%20down%20to%2016x.%20Its%20been%20hanging%20around%2016-17%20for%20most%20of%20the%20year%20and%20on%20the%20recent%20dip,%20dropped%20below%2016.%20Some,%20like%20Morgan's%20equity%20strategist%20now%20see%2016%20as%20the%20ceiling%20for%20the%20market,%20not%20the%20floor.%20His%20reasoning%20is%20that%20higher%20interest%20rates%20impact%20investors%20risk%20premium.%20Something%20to%20think%20about.%20Russell%20seems%20to%20have%20go%20the%20message%20loud%20and%20clear%3C/div%3E%0A%3Cdiv%3E%0A%3Cbr%20/%3E%3C/div%3E%0A%3Cdiv%3E%0A%3Ca%20href%3D%22https://blogger.googleusercontent.com/img/b/R29vZ2xl/AVvXsEis5YTrGugyCL67S90Qi-VH-hYL5hyyZdGfMtmbOfOyLjCC0KddK9uFnHPFGUenB8r2QGZypgf-w3WL1fFgFx_kS1kaaZTPNuNM1qxfL5pO_ZfcKG76aIzkwfYmCKJzOdKr9IvYhQ/s1600/rtype.png%22%20imageanchor%3D%221%22%3E%3Cimg%20border%3D%220%22%20data-original-height%3D%22491%22%20data-original-width%3D%22873%22%20height%3D%22358%22%20src%3D%22https://blogger.googleusercontent.com/img/b/R29vZ2xl/AVvXsEis5YTrGugyCL67S90Qi-VH-hYL5hyyZdGfMtmbOfOyLjCC0KddK9uFnHPFGUenB8r2QGZypgf-w3WL1fFgFx_kS1kaaZTPNuNM1qxfL5pO_ZfcKG76aIzkwfYmCKJzOdKr9IvYhQ/s640/rtype.png%22%20width%3D%22640%22%20/%3E%3C/a%3E%3C/div%3E%0A%3Cdiv%3E%0A%3Cbr%20/%3E%3C/div%3E%0A%3Cdiv%3E%0AWhile%20companies%20in%20the%20US%20may%20still%20be%20beating%20earning%20and%20buying%20back%20shares,%20its%20possible%20that%20investors%20re-rate%20regardless.%26nbsp;%3C/div%3E%0A%3Cdiv%3E%0A%3Ca%20href%3D%22https://blogger.googleusercontent.com/img/b/R29vZ2xl/AVvXsEhiGHkzPBE2O6vQ86TkVhweKYx3A4JVEEdupLH94ZF91p9Qfy8kot0kWeoEpN27ich6-UETRS8GDpGmMkUXYv1C_xXMNMqTlbbBQDOf4jUY9_Zq2I3ASuscq8ezN1FWpijTFJ2TxA/s1600/daxpe.png%22%20imageanchor%3D%221%22%3E%3Cimg%20border%3D%220%22%20data-original-height%3D%22491%22%20data-original-width%3D%22873%22%20height%3D%22358%22%20src%3D%22https://blogger.googleusercontent.com/img/b/R29vZ2xl/AVvXsEhiGHkzPBE2O6vQ86TkVhweKYx3A4JVEEdupLH94ZF91p9Qfy8kot0kWeoEpN27ich6-UETRS8GDpGmMkUXYv1C_xXMNMqTlbbBQDOf4jUY9_Zq2I3ASuscq8ezN1FWpijTFJ2TxA/s640/daxpe.png%22%20width%3D%22640%22%20/%3E%3C/a%3E%3C/div%3E%0A%3Cdiv%3E%0A%3Cbr%20/%3E%3C/div%3E%0A%3Cdiv%3E%0A%3Cbr%20/%3E%3C/div%3E%0A%3Cdiv%3E%0ANow%20what%20happens%20is%20EPS%20estimates%20start%20to%20turn%20down,%20like%20they%20are%20in%20Europe.%20Well%20then%20that%20would%20be%20cause%20for%20real%20concern.%20But%20we're%20not%20there%20yet.%26nbsp;%3C/div%3E%0A%3Cdiv%3E%0A%3Cbr%20/%3E%3C/div%3E%0A%3Cdiv%3E%0A%3Cbr%20/%3E%3C/div%3E%0A%3Cdiv%3E%0A%3Cbr%20/%3E%3C/div%3E%0A%3Cdiv%3E%0A%3Cbr%20/%3E%3C/div%3E%0A%3Cdiv%3E%0A%3Cbr%20/%3E%3C/div%3E%0A%3Cbr%20/%3E%0A%3Cbr%20/%3E)