Oversold. Swing Longs: JBLU, FDX 3 Aug 2011 4:42 PM (13 years ago)
 Market is as oversold as it ever will be, a short term is due no matter what. With oil is tanking I'm also looking for a bounce in the oversold airline and transportation. Be careful and hedge your swing position carefully as the sell-off may start again any time soon. Here are couple of plays:
JBLU. Very oversold with heavy volume accompanied with couple of candlestick reversal pattern. If market can hold on long enough, I can see JBLU come back to restest its old support @ around $5.40


Long TCK, Short EMR 24 Jul 2011 1:24 PM (13 years ago)
 Market is approaching a strong resistance on the S&P. while I still stay bullish on the market, a bounce off this resistance is not out of the question. Stay at least 50% cash and quick profits are still the way to go. Here are a couple of set ups for next week.
TCK (Long) Look for a break out above 53.90 and we probably can see some momentum run toward the $57 level for our first target

EMR (Short) Market is getting a bit overbought so it doesn't hurt to put on a short position as a hedge for our longs. EMR bounced off a heavy descending resistance and made a small pullback to test the 200MA and also bounced there. Looking a a continuation of this strong down trend as it breaks $54.58.

%20Look%20for%20a%20break%20out%20above%2053.90%20and%20we%20probably%20can%20see%20some%20momentum%20run%20toward%20the%20$57%20%26nbsp;level%20for%20our%20first%20target%3Cbr%20/%3E%3Cbr%20/%3E%3Cdiv%3E%3Ca%20href%3D%22http://4.bp.blogspot.com/-TJGNEGOFXNo/TiyMK3K-s0I/AAAAAAAAAYo/IWf72Ox6XvU/s1600/TCK+Daily.png%22%20imageanchor%3D%221%22%3E%3Cimg%20border%3D%220%22%20height%3D%22400%22%20src%3D%22http://4.bp.blogspot.com/-TJGNEGOFXNo/TiyMK3K-s0I/AAAAAAAAAYo/IWf72Ox6XvU/s640/TCK+Daily.png%22%20width%3D%22640%22%20/%3E%3C/a%3E%3C/div%3E%3Cdiv%3E%3Cbr%20/%3E%3C/div%3E%3Cbr%20/%3EEMR%20(Short)%20Market%20is%20getting%20a%20bit%20overbought%20so%20it%20doesn't%20hurt%20to%20put%20on%20a%20short%20position%20as%20a%20hedge%20for%20our%20longs.%20EMR%20bounced%20off%20a%20heavy%20descending%20resistance%20and%20made%20a%20small%20pullback%20to%20test%20the%20200MA%20and%20also%20bounced%20there.%20Looking%20a%20a%20continuation%20of%20this%20strong%20down%20trend%20as%20it%20breaks%20$54.58.%3Cbr%20/%3E%3Cbr%20/%3E%3Cdiv%3E%3Ca%20href%3D%22http://4.bp.blogspot.com/-0YWXXx_LFyU/TiyMQY2aVhI/AAAAAAAAAYs/Qav-2G2tEH8/s1600/EMR+Daily.png%22%20imageanchor%3D%221%22%3E%3Cimg%20border%3D%220%22%20height%3D%22400%22%20src%3D%22http://4.bp.blogspot.com/-0YWXXx_LFyU/TiyMQY2aVhI/AAAAAAAAAYs/Qav-2G2tEH8/s640/EMR+Daily.png%22%20width%3D%22640%22%20/%3E%3C/a%3E%3C/div%3E%3Cdiv%3E%3Cbr%20/%3E%3C/div%3E)
Bulls Resume: CROX and CMG 19 Jul 2011 5:23 PM (13 years ago)
 Pullback is finally over, and the bulls seem to be able to take control once again with the support from earnings.
Expect this rally to test recent high and even May high. Here are a couple of setups to take advantage of this rally:
CROX Perfect pullback to 20MA and consolidate there while market was selling off. Tuesday's relief triggers the rally from CROX to resume its strong up trend.


Short USO, EFX. 10 Jul 2011 11:58 AM (13 years ago)
 USO (short) - Bounced off short-term descending resistance and 200MA a week after the US released the oil reserves. Expect USO to drop to $35 level before we can another bounce.


%20-%20Bounced%20off%20short-term%20descending%20resistance%20and%20200MA%20a%20week%20after%20the%20US%20released%20the%20oil%20reserves.%20Expect%20USO%20to%20drop%20to%20$35%20level%20before%20we%20can%20another%20bounce.%3Cbr%20/%3E%3Cbr%20/%3E%3Cdiv%3E%3Ca%20href%3D%22http://2.bp.blogspot.com/-jzmJRfXmEq0/ThoBEmVJodI/AAAAAAAAAYY/McgkUMUo6Xw/s1600/USO+Daily.png%22%20imageanchor%3D%221%22%3E%3Cimg%20border%3D%220%22%20height%3D%22400%22%20src%3D%22http://2.bp.blogspot.com/-jzmJRfXmEq0/ThoBEmVJodI/AAAAAAAAAYY/McgkUMUo6Xw/s640/USO+Daily.png%22%20width%3D%22500%22%20/%3E%3C/a%3E%3C/div%3E%3Cdiv%3E%3Cbr%20/%3E%3C/div%3E%3Cdiv%3EEFX%20(short)%20-%20Similar%20set%20up%20with%20a%20bounce%20off%20descending%20resistance%20and%20200MA%20with%20island%20reversal%20candlestick%20pattern.%20Expect%20the%20test%20of%20recent%20low%20but%20keep%20a%20tight%20stop%20as%20market%20seems%20to%20still%20be%20in%20its%20uptrend.%26nbsp;%3C/div%3E%3Cdiv%3E%3Ca%20href%3D%22http://2.bp.blogspot.com/-VJJWdPFu5Vs/ThoBOr8C4ZI/AAAAAAAAAYc/gBrKzdYmpi8/s1600/EFX+Daily.png%22%20imageanchor%3D%221%22%3E%3Cimg%20border%3D%220%22%20height%3D%22400%22%20src%3D%22http://2.bp.blogspot.com/-VJJWdPFu5Vs/ThoBOr8C4ZI/AAAAAAAAAYc/gBrKzdYmpi8/s640/EFX+Daily.png%22%20width%3D%22500%22%20/%3E%3C/a%3E%3C/div%3E%3Cdiv%3E%3Cbr%20/%3E%3C/div%3E)
Long: AAPL, ANF. Short NCI, ZLC. 4 Jul 2011 9:59 PM (13 years ago)
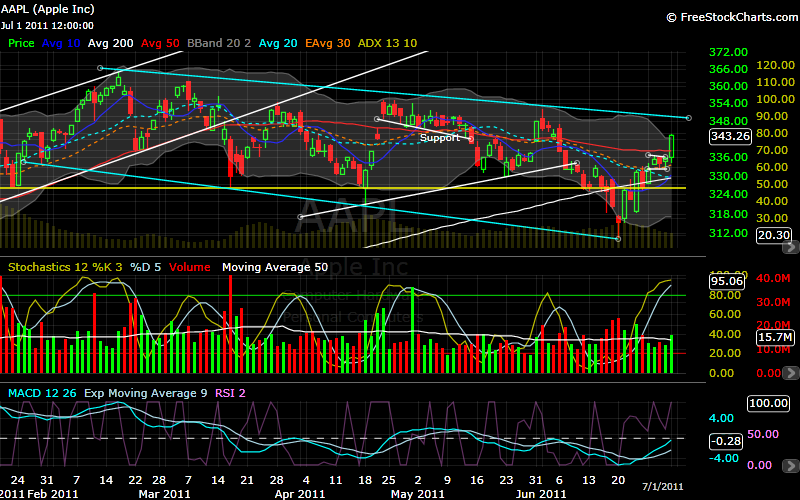
 AAPL - Broke out of mini bull flag approaching a weekly downward channel resistance with good momentum. The bollinger band is opening up as it approaching the top line of the band. There is a good potential AAPL will break this channel and start a new up trend.


Does history rhyme? $SPX 2 Jul 2011 8:59 PM (13 years ago)
 Market showed off a very powerful week at the end of June with 5 straight winning days but would that mean the end of this bear market? Some may say so considering all those 5 days market closed at the top of its candles. Interestingly though, I found some surprising similarities between this market and the summer 2010 when market also in a major sell-off. History doesn't repeat but will it rhyme?
Take a look at this chart in 2010:
In the square, market rallied off what seems to be a small double bottom pattern after the moving averages crossed over. Then follow another heavy sell-off with heavy volume before entering a months long trading range.

Here's the chart of our current year:
We find a very similar pattern here with a rallied off a small double-bottom at the 200MA Will there be a sell-off follow after this? We certainly cannot ignore the possibility but there are some major differences between these two charts. Our price action in the 2011 is much stronger, we managed to bounce almost back to previous high and well above all major moving averages especially the 50MA (red) and 200MA (white). In 2010 we did not.

My sentiment is bullish in this current move and watch out for some potential longs, however I will be mostly in cash as the possibility of a sell off is still in the cards. Additionally, this market is well over bought, if a sell-off doesn't happen, a consolidation or pullback is due for the short term.
%20and%20200MA%20(white).%20In%202010%20we%20did%20not.%3Cbr%20/%3E%3Cdiv%3E%3Ca%20href%3D%22http://1.bp.blogspot.com/-pCa5ud_W-RU/Tg_1pPc_1UI/AAAAAAAAAYE/vlZtoqNcIzI/s1600/S%252526P+Daily+now.png%22%20imageanchor%3D%221%22%3E%3Cimg%20border%3D%220%22%20height%3D%22400%22%20src%3D%22http://1.bp.blogspot.com/-pCa5ud_W-RU/Tg_1pPc_1UI/AAAAAAAAAYE/vlZtoqNcIzI/s640/S%252526P+Daily+now.png%22%20width%3D%22500%22%20/%3E%3C/a%3E%3C/div%3E%3Cbr%20/%3EMy%20sentiment%20is%20bullish%20in%20this%20current%20move%20and%20watch%20out%20for%20some%20potential%20longs,%20however%20I%20will%20be%20mostly%20in%20cash%20as%20the%20possibility%20of%20a%20sell%20off%20is%20still%20in%20the%20cards.%20Additionally,%20this%20market%20is%20well%20over%20bought,%20if%20a%20sell-off%20doesn't%20happen,%20a%20consolidation%20or%20pullback%20is%20due%20for%20the%20short%20term.)
Tug O' War: BK Long, MCP Short 28 Jun 2011 9:17 PM (13 years ago)
 Despite the last two easy win for the bulls, market is still within a trading range that it has been bouncing around for the last 3 weeks. This market is still uncertain of which direction it will take therefore, cash still feels good at the moment, after all missed profits are always better losses.
Look at the range on SPX 30min chart:

For aggressive traders, it doesn't mean game over, we can still always taking small bites out of this choppy moves by trading momentum and heavy tops & bottoms. Here's one long and one short for this week's watch:
Long - BK (The Bank of New York Mellon) This stock has been a down trend for months now and recently sold off on heavy volume into a major support indicating a bottom is near or a good bounce in place real soon. Wait for a candlestick pattern signal on this stock and hop on as it turns over, the first target is to test $26.

Short: MCP - Molycorp is trading in a broadening downtrend channel, it is pulling up against the upper trend line and likely bounce off. Consider a short position on the bounce in the next couple of sessions with target of $49 and 2nd target on the bottom trend line.

%20This%20stock%20has%20been%20a%20down%20trend%20for%20months%20now%20and%20recently%20sold%20off%20on%20heavy%20volume%20into%20a%20major%20support%20indicating%20a%20bottom%20is%20near%20or%20a%20good%20bounce%20in%20place%20real%20soon.%20Wait%20for%20a%20candlestick%20pattern%20signal%20on%20this%20stock%20and%20hop%20on%20as%20it%20turns%20over,%20the%20first%20target%20is%20to%20test%20$26.%3Cbr%20/%3E%3Cbr%20/%3E%3Cdiv%3E%3Ca%20href%3D%22http://2.bp.blogspot.com/-lE5uZF69nHg/TgqaB8OTwnI/AAAAAAAAAX4/TgvB8suc7yc/s1600/BK+Long+Daily.png%22%20imageanchor%3D%221%22%3E%3Cimg%20border%3D%220%22%20height%3D%22400%22%20src%3D%22http://2.bp.blogspot.com/-lE5uZF69nHg/TgqaB8OTwnI/AAAAAAAAAX4/TgvB8suc7yc/s640/BK+Long+Daily.png%22%20width%3D%22500%22%20/%3E%3C/a%3E%3C/div%3E%3Cdiv%3E%3Cbr%20/%3E%3C/div%3E%3Cbr%20/%3EShort:%20MCP%20-%20Molycorp%20is%20trading%20in%20a%20broadening%20downtrend%20channel,%20it%20is%20pulling%20up%20against%20the%20upper%20trend%20line%20and%20likely%20bounce%20off.%20Consider%20a%20short%20position%20on%20the%20bounce%20in%20the%20next%20couple%20of%20sessions%20with%20target%20of%20$49%20and%202nd%20target%20on%20the%20bottom%20trend%20line.%3Cbr%20/%3E%3Cbr%20/%3E%3Cdiv%3E%3Ca%20href%3D%22http://2.bp.blogspot.com/-cIqeqDSNr38/Tgq1O65NG0I/AAAAAAAAAX8/_eYc2FPOafc/s1600/mcp+daily+short.png%22%20imageanchor%3D%221%22%3E%3Cimg%20border%3D%220%22%20height%3D%22400%22%20src%3D%22http://2.bp.blogspot.com/-cIqeqDSNr38/Tgq1O65NG0I/AAAAAAAAAX8/_eYc2FPOafc/s640/mcp+daily+short.png%22%20width%3D%22500%22%20/%3E%3C/a%3E%3C/div%3E)
Bounce but still bearish. Watch: Long - LINTA, BKS -- Short CREE, SWY 14 Jun 2011 9:54 PM (13 years ago)
 Tuesday was the most the gain the market has been able to pull off for the last 6 weeks, however volume is still not convincing for a meaningful bounce. If economic data still doesn't show any surprising weakness, the bounce may last for a few sessions to recover some of the last week's loss. On a brighter side, the volume in the pull off of the last 6 weeks are still moderate indicating we are not in the bearish sell off like we've seen in the last few years - or... at least not yet. It is best to trade this market by taking small profits and even losses. With that in mind, here are a few positions on both long and short sides:
LONG
BKS - Broke above previous high with good volume and momentum out of a nice cup and handle and ascending triangle at the handle, on hourly chart. Expect this momentum to continue for a few more sessions since BKS wasn't seen affected much the market sell-off. Here's the 30-Minute Chart:


SHORT
CREE - the stock broke out of a bear flag and resting on pivot support, a break below 37.70 can trigger a short position.


Market still in the down trend - SQM 7 Jun 2011 11:09 PM (13 years ago)
 With market still uncertain, it is hard to predict the any turn from here. Market is at its extreme oversold now and a bounce is overdue. Today's bounce was ruined by the Bernanke's speech at the last hour of the trading day making the market returns all its morning gain. Right now I anticipate a little bear flag if market fails to make any meaningful bounce, even that, it should still allow some stocks some room to cover some losses. The best strategy now is either to stay in cash or hedge your position with both some puts on the market or take on both long and short trades in different stocks.
Here's a pick for the potential market bounce:
SQM - The stock broke to new high and pulling back a nice bull flag resting on top of the 10MA. expect another up move in the next session to confirm this move and trade off that momentum.


Playing the bounce: F, TEVA, ADBE, TSLA 25 May 2011 10:05 PM (13 years ago)
 Market finally settled down at the support of the downward channel could potentially bounce in the next session if economic data does not do any major damage. With that in mind, here are few stocks to go long taking advantage of this bounce.
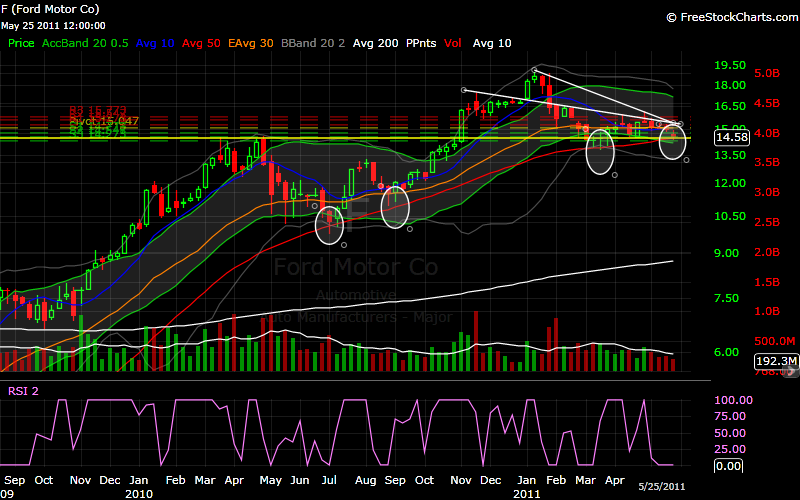
F - Ford has successful bounced off the weekly 50MA quite a few times and it seems it is going to that once again with the price action today with bullish volume and formed a nice hammer on an important support. Here's the weekly chart (Click to enlarge):


Be cautious with this market, as the bulls still trading inside a bearish channel but the bears have not been that strong considering we have not been down that much in May. It may be choppy but the bulls still seem to be in play. Hedge your positions with some options puts or some weak stocks to protect yourself from another sudden turn in the market.
If you have any charts you want me to analyze, please feel free to pop me an email on the contact page. I will either post it on the blog as soon as I can.
Good luck, and happy trading!
:%3Cbr%20/%3E%3Cbr%20/%3E%3Cdiv%3E%3Ca%20href%3D%22http://3.bp.blogspot.com/-bRhDnNsQKvs/Td3oHRvZsMI/AAAAAAAAAXM/nkAfNe1QaR0/s1600/F+Weekly.png%22%20imageanchor%3D%221%22%3E%3Cimg%20border%3D%220%22%20height%3D%22400%22%20src%3D%22http://3.bp.blogspot.com/-bRhDnNsQKvs/Td3oHRvZsMI/AAAAAAAAAXM/nkAfNe1QaR0/s640/F+Weekly.png%22%20width%3D%22500%22%20/%3E%3C/a%3E%3C/div%3E%3Cdiv%3E%3Cbr%20/%3E%3C/div%3ELook%20at%20the%20hammer%20today%20on%20the%20daily%20chart%20and%20bullish%20stochastic%20with%20momentum%20on%20the%20rise:%3Cbr%20/%3E%3Cdiv%3E%3Ca%20href%3D%22http://3.bp.blogspot.com/-yZ4KWE4GrxI/Td3oWvIctEI/AAAAAAAAAXQ/A1hMxD2AZV0/s1600/F+Daily.png%22%20imageanchor%3D%221%22%3E%3Cimg%20border%3D%220%22%20height%3D%22400%22%20src%3D%22http://3.bp.blogspot.com/-yZ4KWE4GrxI/Td3oWvIctEI/AAAAAAAAAXQ/A1hMxD2AZV0/s640/F+Daily.png%22%20width%3D%22500%22%20/%3E%3C/a%3E%3C/div%3E%3Cdiv%3E%3Cbr%20/%3E%3C/div%3ETEVA%20-%20been%20trading%20in%20a%20bottom%20horizontal%20channel%20between%2045%20and%2056.%20It%20broke%20down%20below%20the%20channel%20and%20managed%20to%20got%20back%20in%20where%20it%20filled%20the%20gap.%20The%20stock%20is%20now%20halting%20at%20a%20mid%20resistance%20where%20it%20forms%20a%20bull%20flag%20pulling%20back%20to%20a%20short%20term%20trend%20line%20to%20what%20look%20like%20a%20cup%20and%20handle%20pattern%20if%20you%20ignore%20the%20gap.%20If%20the%20stock%20breaks%20above%2051%20we%20could%20see%20it%20goes%20higher%20to%20test%20the%20channel%20resistance%20at%2056.%3Cbr%20/%3E%3Cdiv%3E%3Ca%20href%3D%22http://3.bp.blogspot.com/-P_2u7LHhGgs/Td3qDpC7L3I/AAAAAAAAAXU/4fRf002usoE/s1600/TEVA+Daily.png%22%20imageanchor%3D%221%22%3E%3Cimg%20border%3D%220%22%20height%3D%22400%22%20src%3D%22http://3.bp.blogspot.com/-P_2u7LHhGgs/Td3qDpC7L3I/AAAAAAAAAXU/4fRf002usoE/s640/TEVA+Daily.png%22%20width%3D%22500%22%20/%3E%3C/a%3E%3C/div%3E%3Cdiv%3E%3Cbr%20/%3E%3C/div%3EADBE%20-%20Big%20inverse%20head%20and%20shoulder%20on%20the%20weekly%20and%20ascending%20triangle%20on%20daily%20with%20rising%20support.%20Expect%20a%20bounce%20here%20when%20it%20touches%20the%20trend%20line%20with%20a%20potential%20breakout%20around%20$36.00.%3Cbr%20/%3E%3Cdiv%3E%3Ca%20href%3D%22http://1.bp.blogspot.com/-HuC6eTnZ2Ew/Td3rRkyCf8I/AAAAAAAAAXY/w5YI3n5mHMc/s1600/adbe+daily.png%22%20imageanchor%3D%221%22%3E%3Cimg%20border%3D%220%22%20height%3D%22400%22%20src%3D%22http://1.bp.blogspot.com/-HuC6eTnZ2Ew/Td3rRkyCf8I/AAAAAAAAAXY/w5YI3n5mHMc/s640/adbe+daily.png%22%20width%3D%22500%22%20/%3E%3C/a%3E%3C/div%3E%3Cdiv%3E%3Cbr%20/%3E%3C/div%3E%3Cdiv%3ETSLA%20-%20Double%20bottom%20in%20March.%20Been%20struggling%20with%20a%20resistance%20the%20last%202%20months%20with%20rising%20support.%20A%20strong%20momentum%20move%20on%20Wednesday%20break%20it%20out%20lightly%20above%20resistance%20and%20looking%20to%20continue%20toward%20an%20unfilled%20gap.%20Next%20resistance%20around%2032.50-32.86.%3C/div%3E%3Cdiv%3E%3Ca%20href%3D%22http://3.bp.blogspot.com/-kZCoAh4iBqA/Td3sPaKn5DI/AAAAAAAAAXc/NKPcgaKyiq0/s1600/TSLA+Daily.png%22%20imageanchor%3D%221%22%3E%3Cimg%20border%3D%220%22%20height%3D%22400%22%20src%3D%22http://3.bp.blogspot.com/-kZCoAh4iBqA/Td3sPaKn5DI/AAAAAAAAAXc/NKPcgaKyiq0/s640/TSLA+Daily.png%22%20width%3D%22500%22%20/%3E%3C/a%3E%3C/div%3E%3Cdiv%3E%3Cbr%20/%3E%3C/div%3E%3Cbr%20/%3EBe%20cautious%20with%20this%20market,%20as%20the%20bulls%20still%20trading%20inside%20a%20bearish%20channel%20but%20the%20bears%20have%20not%20been%20that%20strong%20considering%20we%20have%20not%20been%20down%20that%20much%20in%20May.%20It%20may%20be%20choppy%20but%20the%20bulls%20still%20seem%20to%20be%20in%20play.%20Hedge%20your%20positions%20with%20some%20options%20puts%20or%20some%20weak%20stocks%20to%20protect%20yourself%20from%20another%20sudden%20turn%20in%20the%20market.%3Cbr%20/%3E%3Cbr%20/%3EIf%20you%20have%20any%20charts%20you%20want%20me%20to%20analyze,%20please%20feel%20free%20to%20pop%20me%20an%20email%20on%20the%20contact%20page.%20I%20will%20either%20post%20it%20on%20the%20blog%20as%20soon%20as%20I%20can.%3Cbr%20/%3E%3Cbr%20/%3EGood%20luck,%20and%20happy%20trading!)
UUP - The dollar is testing a major resistance. 23 May 2011 8:54 AM (13 years ago)
 The strength in the dollar has been putting heavy weight on both equities and commodities. However, whether this is a real move or not it's sbeing questioned. Currently UUP is testing a a major broken support coincidentally crossing with a major downward long term trend line resistance. If UUP fail to break this resistance, we can see the dollar to continue its down trend, and a surge in Gold prices, and perhaps a bounce in equities in the next few sessions.
Here's the weekly chart of UUP:


Dead Cat Bounce or Trend Continuation? 17 May 2011 8:42 PM (13 years ago)
 Today after a relentless two weeks of choppy action and continuous sell-off. Market seems to exhausted out all the sellers today in the early morning and buyers came in in the afternoon to form a nice bullish hammer at the support of the trend line. Would this be a trend continuation reversal or is it just another dead cat bounce like the ones we had last week? According to the chart, this should be valid reversal to continue a choppy up trend to the end of May.

Here are a couple of setups looking ready to bounce along with the market:
XLNX - On a very strong up trend and got pulled down by the market to test the recent high where it formed a bullish long legged doji. A bounce to the upside is imminent.

ENB - Tested a long term trend line and 50MA where it bounced off nicely with a bullish engulfing pattern


Trade Well!

A Technical Look on the Market 14 May 2011 12:20 PM (13 years ago)


Trade well!
:%20Despite%20the%20crazy%20selling%20we've%20seen%20the%20last%20two%20weeks,%20the%20bulls%20managed%20stay%20on%20top%20of%20support%20(1330-1340).%20A%20break%20of%20this%20support%20may%20lead%20us%20to%20test%20the%2050MA%20and%20longer%20term%20trend%20line%20support.%20If%20that%20happens,%20the%20summer%20bears%20will%20rally,%20even%20though%20for%20me%20it's%20still%20early%20for%20that%20to%20happen%20from%20a%20short%20term%20trading%20point%20of%20view.%3C/div%3E%3Cdiv%3E%3Ca%20href%3D%22http://2.bp.blogspot.com/-JEdLAxSMObg/Tc7cZT6yVnI/AAAAAAAAAWw/IZCrLbid8yo/s1600/S%252526P+Daily.png%22%20imageanchor%3D%221%22%3E%3Cimg%20border%3D%220%22%20height%3D%22480%22%20src%3D%22http://2.bp.blogspot.com/-JEdLAxSMObg/Tc7cZT6yVnI/AAAAAAAAAWw/IZCrLbid8yo/s640/S%252526P+Daily.png%22%20width%3D%22640%22%20/%3E%3C/a%3E%3C/div%3E%3Cdiv%3E%3Cbr%20/%3E%3C/div%3ES%26amp;P%2030Min%20Intraday%20Chart%20(Click%20to%20Enlarge):%20This%20chart%20can%20put%20the%20S%26amp;P%20intraday's%20craziness%20into%20a%20little%20more%20perspective.%20Our%20intraday%20action%20has%20been%20trading%20in%20the%20range%20of%20support%20(1330-1340)%20to%20resistance%20(1355-1360)%20There's%20still%20no%20certainty%20which%20direction%20the%20S%26amp;P%20will%20take%20for%20now,%20as%20we%20have%20room%20for%20both%20the%20downside%20and%20upside.%20My%20sentiment%20is%20that%20this%20market%20still%20has%20more%20upside%20to%20it%20even%20if%20it%20will%20have%20to%20test%20the%20longer%20term%20trend%20line.%20If%20this%20market%20was%20to%20crash,%20it%20probably%20has%20already%20done%20so,%20the%20bears%20don't%20have%20mercy%20when%20it%20comes%20to%20sell-off.%20Recent%20choppy%20action%20indicates%20bulls%20are%20still%20in%20play,%20and%20we%20are%20still%20in%20a%20pullback.%3Cbr%20/%3E%3Cdiv%3E%3Ca%20href%3D%22http://1.bp.blogspot.com/-c6xNsl76MNM/Tc7gYWTRxtI/AAAAAAAAAW0/aLmHPcbUozM/s1600/S%252526P+30Min.png%22%20imageanchor%3D%221%22%3E%3Cimg%20border%3D%220%22%20height%3D%22480%22%20src%3D%22http://1.bp.blogspot.com/-c6xNsl76MNM/Tc7gYWTRxtI/AAAAAAAAAW0/aLmHPcbUozM/s640/S%252526P+30Min.png%22%20width%3D%22640%22%20/%3E%3C/a%3E%3C/div%3E%3Cbr%20/%3ETrade%20well!%3Cbr%20/%3E)
Fresh Bounces: AAPL, CAR 10 May 2011 8:53 PM (13 years ago)
 Here are two more potential bounces as market still seems to have some momentum left in it.
AAPL - Formed a base after breaking off a downward trend channel. It's resting on the support of 50MA while 20MA is crossing up and over. There's the potential it will get support from the market to challenge some previous high resistance.


Fresh Bounces: AAPL, CAR 10 May 2011 8:53 PM (13 years ago)
Here are two more potential bounces as market still seems to have some momentum left in it.
AAPL - Formed a base after breaking off a downward trend channel. It's resting on the support of 50MA while 20MA is crossing up and over. There's the potential it will get support from the market to challenge some previous high resistance.

Bulls are back. COF, SYNA, EBAY 8 May 2011 10:43 PM (13 years ago)
 Market made a big up move early Friday on unemployment reports but then capped up and returned some gains on Greek news. After the close, Greek cleared the issue by assuring that they will not leave the Euro. We should the bulls to make a come back on Monday. On that note, most of last week's picks are still in play, and in addition, here are are few more to watch for the week:
COF - Capital One Financial broke out nicely off a strong resistance and came back to test it with a nice bounce on Friday should continue its uptrend on market strength.


Stack Them Up - STEC, XLNX, STX, HOTT, MYL, COH, 4 May 2011 10:38 PM (13 years ago)
 Here's my pullback stocks watch list for the next few sessions:
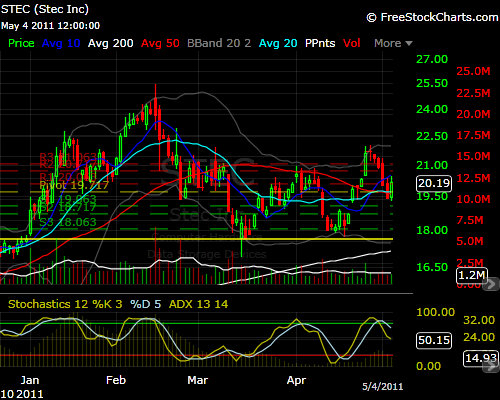
STEC - STEC Inc.


HOTT - Hot Topic


Good luck trading!

Pullback positioning: JDAS, TRS, F 3 May 2011 9:23 PM (13 years ago)
 JDAS After a powerful JDAS been pulling back orderly and formed bullish harami on Tuesday. However I'm looking for a bounce more at the old resistance which is now acting as support around 31.10 level which also corresponds the the 10MA. That is the safe play, but this could bounce as soon as the next day to confirm the harami if market permits.


Long: CROX, Short: VECO 2 May 2011 9:39 PM (14 years ago)
 Market is due for pullback after such a strong run. Though I believe there is still more upside for the bulls. This pullback may be either mild or violent all depending the headlines for the next few days. If there is no major shaking news in the market, we should see a mild consolidation or light pullback toward the 10MA. I'll keep my positions on light quantity this week, and perhaps taking advantage of this move with some bearish setups.
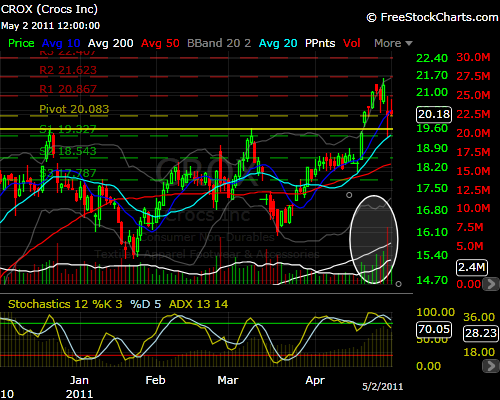
CROX (long) The stock broke out 2 weeks ago and impressive volume and is forming the first pullback to test the old resistance. Supports can be seen in the pullback candles. This is a good setup for a positioning play while market is in profits taking mode.

%20The%20stock%20broke%20out%202%20weeks%20ago%20and%20impressive%20volume%20and%20is%20forming%20the%20first%20pullback%20to%20test%20the%20old%20resistance.%20Supports%20can%20be%20seen%20in%20the%20pullback%20candles.%20This%20is%20a%20good%20setup%20for%20a%20positioning%20play%20while%20market%20is%20in%20profits%20taking%20mode.%3Cbr%20/%3E%3Cbr%20/%3E%3Cdiv%3E%3Ca%20href%3D%22http://4.bp.blogspot.com/-G5mrHDUXNjQ/Tb-TtFrYS0I/AAAAAAAAAVo/BdaCsuQ0nGM/s1600/Crox+daily.png%22%20imageanchor%3D%221%22%3E%3Cimg%20border%3D%220%22%20src%3D%22http://4.bp.blogspot.com/-G5mrHDUXNjQ/Tb-TtFrYS0I/AAAAAAAAAVo/BdaCsuQ0nGM/s1600/Crox+daily.png%22%20/%3E%3C/a%3E%3C/div%3E%3Cdiv%3E%3Cbr%20/%3E%3C/div%3EVECO%20(Short)%20-%20This%20stock%20been%20trading%20in%20a%20wide%20range%20consolidation%20for%20month%20now%20and%20is%20approaching%20resistance%20once%20again%20on%20declining%20volume%20while%20formed%20a%20shooting%20star%20on%20Monday.%20It%20is%20currently%20overbought%20since%20it's%20been%20running%20up%20with%20the%20market.%20With%20market%20pulling%20back,%20I%20expect%20VECO%20to%20also%20bounce%20off%20resistance.%3Cbr%20/%3E%3Cbr%20/%3E%3Cdiv%3E%3Ca%20href%3D%22http://3.bp.blogspot.com/-Kv8jOWbiDyQ/Tb-URpnXXDI/AAAAAAAAAVs/nFedd-Xq2O4/s1600/VECO+Daily.png%22%20imageanchor%3D%221%22%3E%3Cimg%20border%3D%220%22%20src%3D%22http://3.bp.blogspot.com/-Kv8jOWbiDyQ/Tb-URpnXXDI/AAAAAAAAAVs/nFedd-Xq2O4/s1600/VECO+Daily.png%22%20/%3E%3C/a%3E%3C/div%3E%3Cdiv%3E%3Cbr%20/%3E%3C/div%3E%3Cdiv%3E%3C/div%3E%3Cdiv%3E%3Cbr%20/%3E%3C/div%3E%3Cdiv%3E%3Cbr%20/%3E%3C/div%3E)
Till the Last Bull Fall - ESRX, RHT, S, and ENTR 28 Apr 2011 9:05 PM (14 years ago)
 ESRX - Express Scripts formed A beautiful inverse head and shoulder pattern with great momentum run on Friday. The scenarios are the stock will either continue on this run tomorrow breaking the neck line or it will form a light pullback or consolidation at resistance before breaking the neck line.

S - Sprint Nextel broke out of a symmetrical triangle on Thursday on a breakaway gap with high call/put options ratio.


On the last note, beware of the overbought market but don't be afraid of buying dips and hold as i believe this bull run still has some juice left in it before QE2 run out. Till the last bull fall, bears will have to wait. Good luck trading!

Potential Breakouts to Watch: DF, BR, 26 Apr 2011 9:55 PM (14 years ago)
 BR - Broadridge Fin Sol been trading in a horizontal channel for months, it's just broke out of a bull flag with good momentum and testing the resistance once again. A break above this level can make a new up trend for this stock


Uncertain Market - Watch List: DNDN, AVL, TLCR 24 Apr 2011 10:03 PM (14 years ago)
 Considering a strong pullback we had recently, I suspect that this market is topping out, any of pullback we are going to have should be very volatile. Many bad news are lurking around the corners, and bears will take advantage of these news very aggressively moving into summer and the end of QE2. Despite the strong movements during the past few days, market has been moving into the overbought zone and any new positions should be quick in profits taking and losses should be cut as early as possible. With that in mind, here are stocks on my watch list for next week:


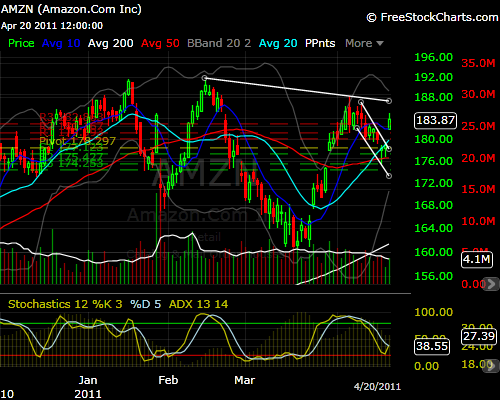
Catching market Momentum: AMZN, HWD, FCS 20 Apr 2011 9:43 PM (14 years ago)
 AMZN pulled back in a bull flag to fill up a recent continuation gap and bounced nicely off the 50MA after forming 2 bullish hammer during the market pullback. I expect to break the recently high and test 192 level soon.


NEOP, PRSP on the Watch 17 Apr 2011 9:38 PM (14 years ago)
 NEOP - Neoprobe corporation is setting up a very nice symmetrical triangle with volume drying out on the pullback, a break out of this triangle is imminent. There are rumors for a buyout on NEOP so it could help move the stock out of triangle.


ORCL, LM on the watch 12 Apr 2011 11:09 PM (14 years ago)
 Market made a pullback after the consolidation last week create quite a few pullbacks play opportunities even though several of the setups I was watching didn't hit the trigger point. Despite the market sell off on Tuesday, retail seemed to outperformed the rest of the market anticipating the retails sales data on Wednesday.
Among them LM stands out with a perfect move out of a bear flag toward an important resistance. If the retail data comes out good, this should help push LM to the break out level and to a more open area for more room to move. here's the chart:


